
When the Japanese space agency's SLIM smart lander settled down onto the moon in January this year, the real feat wasn’t just getting to the rocky satellite, but making a soft landing to 100m accuracy within the Shiholi crater.
The craft itself weighed 200 kilos, but fuel, at least at launch, added another 500 kilos. Needless to say, keeping the mission on track required ground-based crew monitoring multiple streams of information on the health of the lander. These included velocity, acceleration, temperature and position readings, and the health of the various systems such as the aerosols that direct the lander.
Naturally, the ground-based team needed to be able to read off key information at a glance. Unfortunately, as Satoshi Nakahira, associate senior researcher at ISAS/JAXA’s Science Satellite and Data Archive Unit, explained to The Stack at Grafanacon this week, the agency’s legacy Quick Look system left researchers scrambling for key information during the mission. As Nakahira explains, there were simply too many characters and parameters for control team members to easily and quickly grasp what was happening.
Nakahira described the challenge as similar to an IoT system, except all the streams of data are effectively coming from a single system and beamed across space to a ground station then onto the SLIM control centre.
While scientific data is examined over a longer time scale, housekeeping data had to be accessible to monitor the status of the craft and its systems. The health of the heater system is critical, for example, “because instruments can be damaged by extremely low temperature of space.” Temperatures range from -170C to 110C.
The original on-prem Linux-based system the agency used was built around 15 years ago by NEC. It was too complex and too expensive says Nakahira, and increasingly out of date. “This software is a monolithic software. So, it is not easy to maintain or add new features.” Just operating it was “very difficult”. Installing anything new “is almost impossible.”
Nakahira proposed supplementing the Quick Look system with dashboard-like information by using Grafana. He described it as his “personal mission.” However, he says, his proposal to bring an open-source tool to a closed monolithic wasn’t immediately welcomed.
Initially at least, “Most people didn’t agree.” However, some colleagues were interested in doing things in-house and willing to work with Nakahira. The team putting the system together was relatively young and comprised mainly of engineers, rather than astrophysicists. There was just one professor involved.
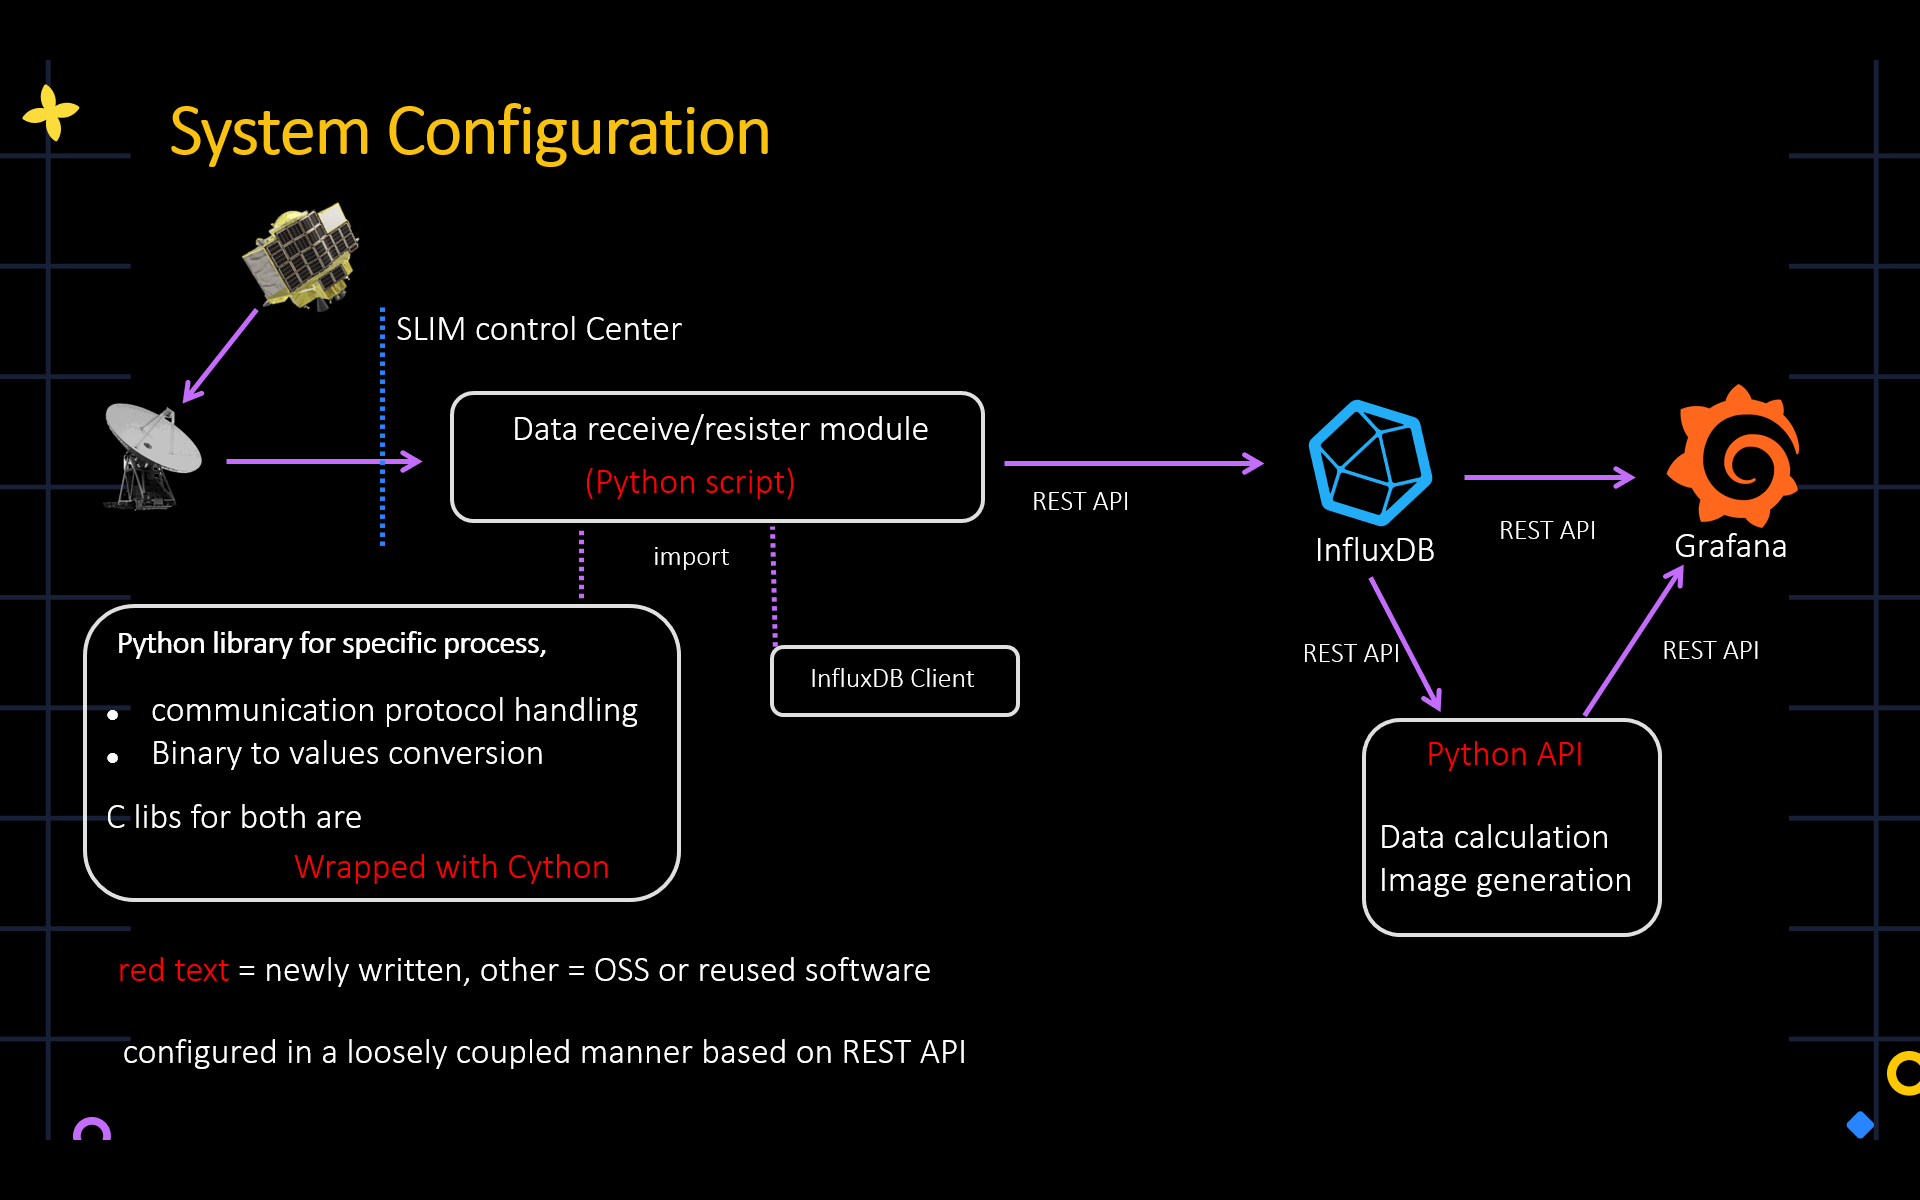
The architecture includes a data receive/register module, written in Python. Cython – the superset of the Python language which supports C calls - was used to ease the integration for specific processes. Data is then moved into InfluxDB, then into Grafana via a Rest API and a Python API.
Ten dashboards were constructed in total, corresponding to different objectives and operational phases of the mission, and spanning information including system state, plots, logs, and time series data. Testing the system involved “many lots of simulation data…running it with simulation data is very important.” As of course was checking the display system itself.
The “classic” Quick Looks were still dominant, but Nakahira said the Grafana-based systems played an “important role”. In the event, the control room team and viewers on YouTube were all looking at the same dashboard during the mission.
Nakahira said he started on the project two years before Slim started operations, though the development itself was between half a year and one year. Traditionally Space systems use older but proven and extremely stable software. Embedded versions of Windows have lived on in space long after they were deprecated on Earth.
But open-source tools are developed iteratively, going through multiple versions during the sort of development cycles typical in space missions. Nakahira said “During two years, I started on Grafana 7 and finally operated in Grafana 10. There is no problem.” Many other packages used by the likes of Nakahira were incremented over the period, he added, such as graphing tool xyplot.
While the setup for the SLIM mission was a one-off, Nakahira said “There are some other missions that are interested in our system.” These include planned missions to Mars’ moons and a planned mission to Mercury. Jaxa might not be expecting to find life on Mars, but at least they'll know whether the heating system is still live.


