
Last year we tried to estimate the carbon footprint of cloud workloads and found that the main missing piece was the power consumption of cloud resources, writes Benjamin Davy, Innovation Manager, Teads. To answer this, we simulated several kinds of workloads and measured memory and CPU consumption on five bare metal instances. In this article, we will start by taking a closer look at the hardware behind the EC2 service and try to compare it with existing power benchmarks (Chapter 1). Then we will follow-up with:
- A review on existing research on power modeling applied to cloud infrastructure as well as papers describing factors that can have a great impact on actual consumption (Chapter 2),
- Our experiment and the tooling we have used to build power consumption profiles for a set of EC2 instances (Chapter 3),
- Finally, we analyze the results and list key findings (Chapter 4 & 5).
1 — A closer look at AWS instances
As a reminder, we are trying to find a way to convert our EC2 hourly usage metrics into kWh. In order to estimate the power consumption of instances, our hypothesis is that if we can have the consumption at the hardware level, then we can simply use a converting factor based on the number of vCPU.
For this approach to be valid we have to make sure that when we are launching an instance we are actually running on a fraction of the hardware.
1.1 — How instances are sized and what’s inside
In this great talk from re:Invent 2017, Adam Boeglin describes how c5 instances are sized. Basically, resources are cut into instances in a linear fashion. In his example, the c5.18.xlarge instance is the equivalent of two 9.xlarge instances and the CPU to memory ratio stays the same across all sizes.
What’s most important is that resources are dedicated to an instance with no overcommitment, with only the exception of the t* instance family. This confirms we can safely use the power consumption of a whole machine and divide it to be used for instance-level power estimations.
“When you are running the largest size instance you are using an entire physical server” — Adam Boeglin, AWS re:Invent 2017
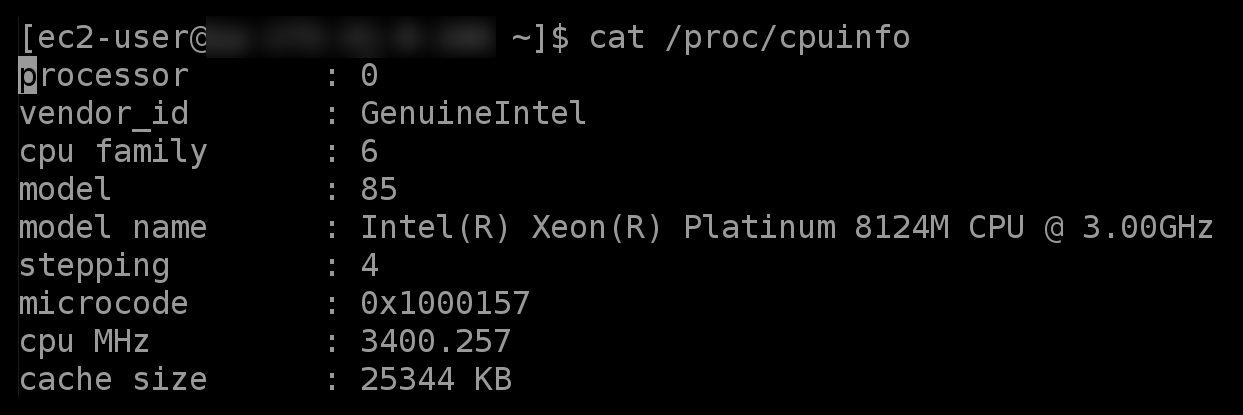
AWS official documentation provides us with some details about the CPU used in instances and we have access to the precise CPU specifications by reading the /proc/cpuinfo.
Below is a table summarizing the hardware specifications for c5, r5, m5, z1d, and m5zn instances. AWS uses custom-made CPUs so the exact specifications are not listed in the official Intel Ark database.
However, these CPUs are also sold on unofficial channels and listed in alternative databases such as CPU World.
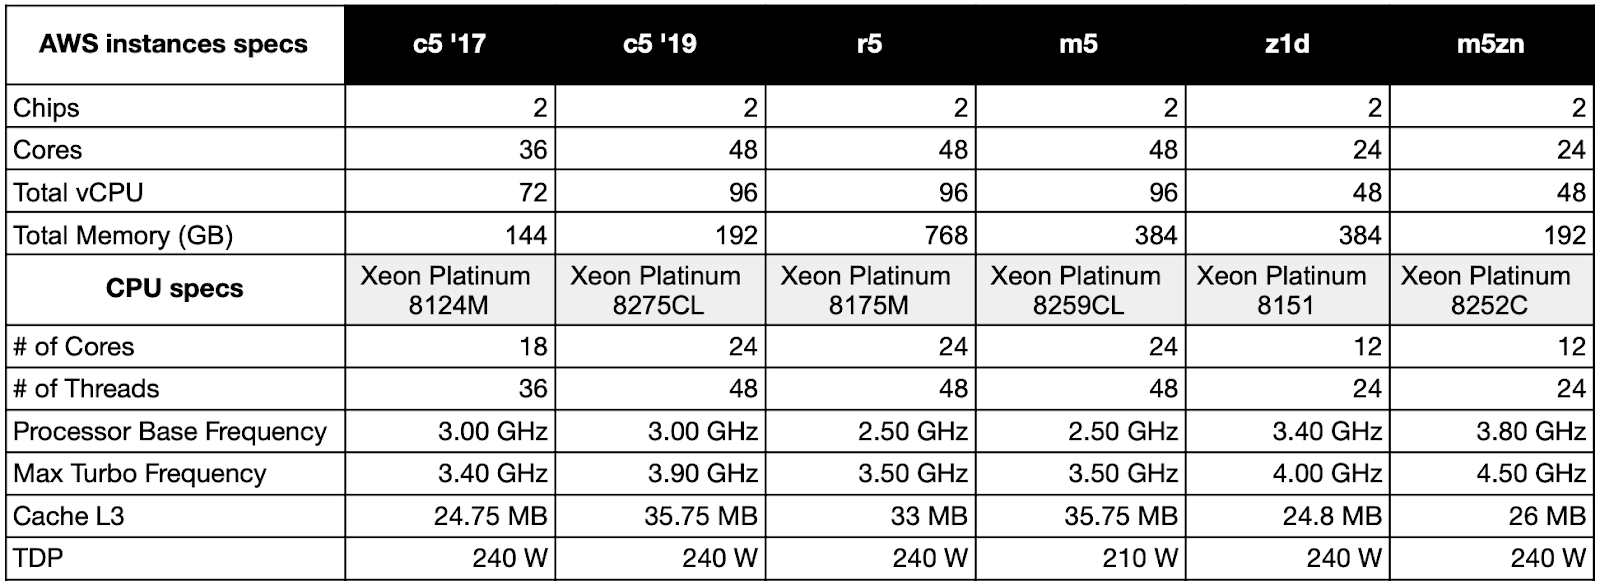
As we can see, there are at least two kinds of hardware for the c5. The c5 instances were initially launched in 2017 with the c5.18xlarge being the largest instance within the family. Looking at cpuinfo we can see that it is running on a dual Xeon Platinum 8124M CPU configuration. This seems valid as the c5.18xlarge has 72 vCPUs available and each 8124M CPU has 18 cores (hence 36 threads or vCPUs).
In 2019, new c5 instances were launched along with a bare-metal option, the underlying hardware is different as suggested by the vCPU count and as reported in the cpuinfo. This could mean that, if we look for the best accuracy, we cannot really apply a global profile based on bare metal measurements to the entire range of instances within the c5 family.
In late 2020 AWS launched the m5zn, advertised as the “Fastest Intel Xeon Scalable CPU in the Cloud”, following the z1d launched in 2018. These compute-intensive instances provide “extremely high per-core performance” and we thought it would be interesting to analyze them as well.
1.2 — Looking for power profiles of equivalent server configurations
Using these hardware specifications we tried to find comparable servers in the SPECpower database. SPECpower [1] is an industry-standard benchmark that evaluates the power and performance characteristics of servers. It requires a power analyzer device to be able to measure power at the AC input while running a set of workloads (mostly CPU and memory-bound).
Here is an example of a SPECpower benchmark summary:
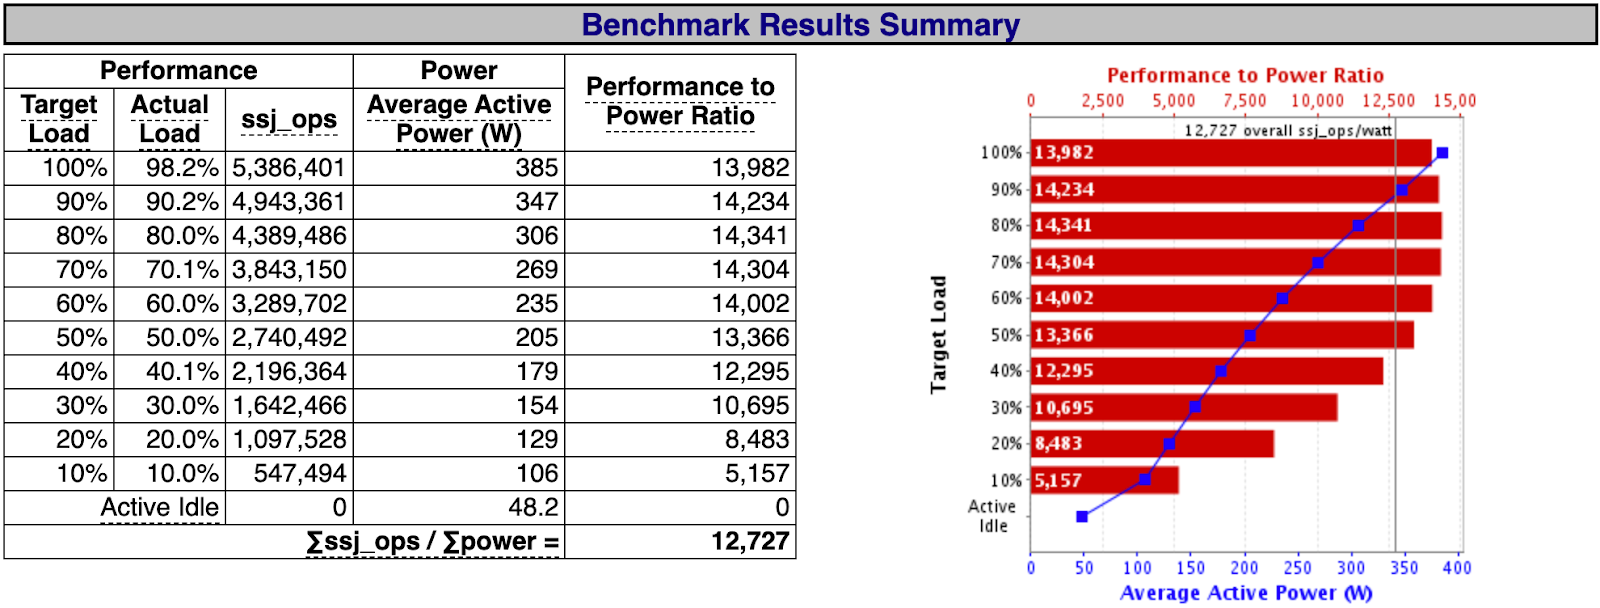
As we can see, SPECpower reports power consumption at different load levels expressed in percentages and number of operations. The benchmark is first run at full capacity to determine the maximum throughput of the system (100%). Then the benchmark runs with different throughput targets corresponding to measurement intervals. Hence, these percentages are not equal to CPU utilization rates but rather a fraction of the maximum processing capacity of the machine for this specific workload.
As commented by Congfeng Jiang [2], SPECpower is designed to assess server energy efficiency and may not represent real-world workloads running on servers in a datacenter.
However, SPECpower data has been used extensively in many research studies and we couldn’t find an alternate option. Looking at the available reports we selected machines that had similar characteristics compared to a c5.metal instance (CPU generation, family, frequency, threads, TDP, and total memory).
Here is our selection compared to a c5.metal (SPECpower reports 1/2/3/4/5):
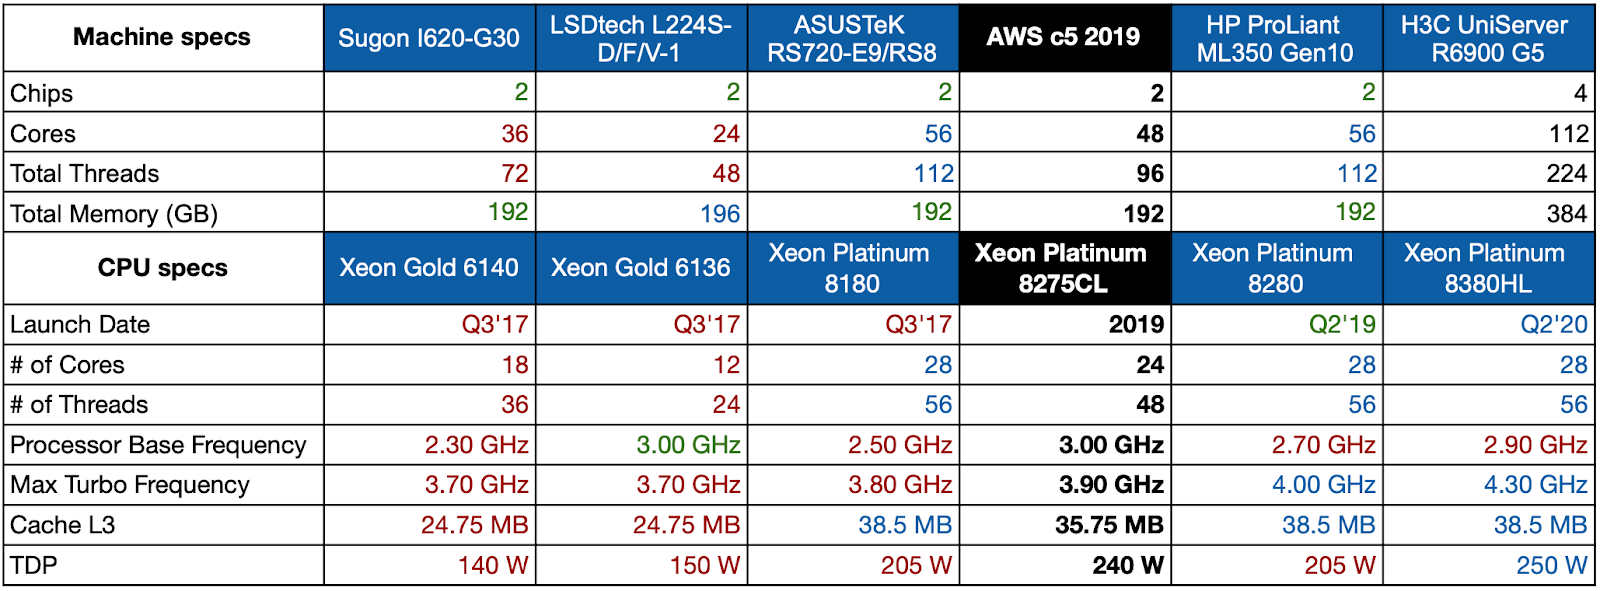
Unfortunately, we couldn’t find an exact match and the H3C machine on the right is double the size of a c5.metal (quad CPU). However, we decided to keep it in our comparison because it uses a CPU model that has a closer TDP (250 W) compared to the other machines.
If we plot these SPECpower report consumption numbers we can see that they are relatively close to one another. Here we have simply divided by two the Average Active Power numbers reported for the H3C machine and added an average:
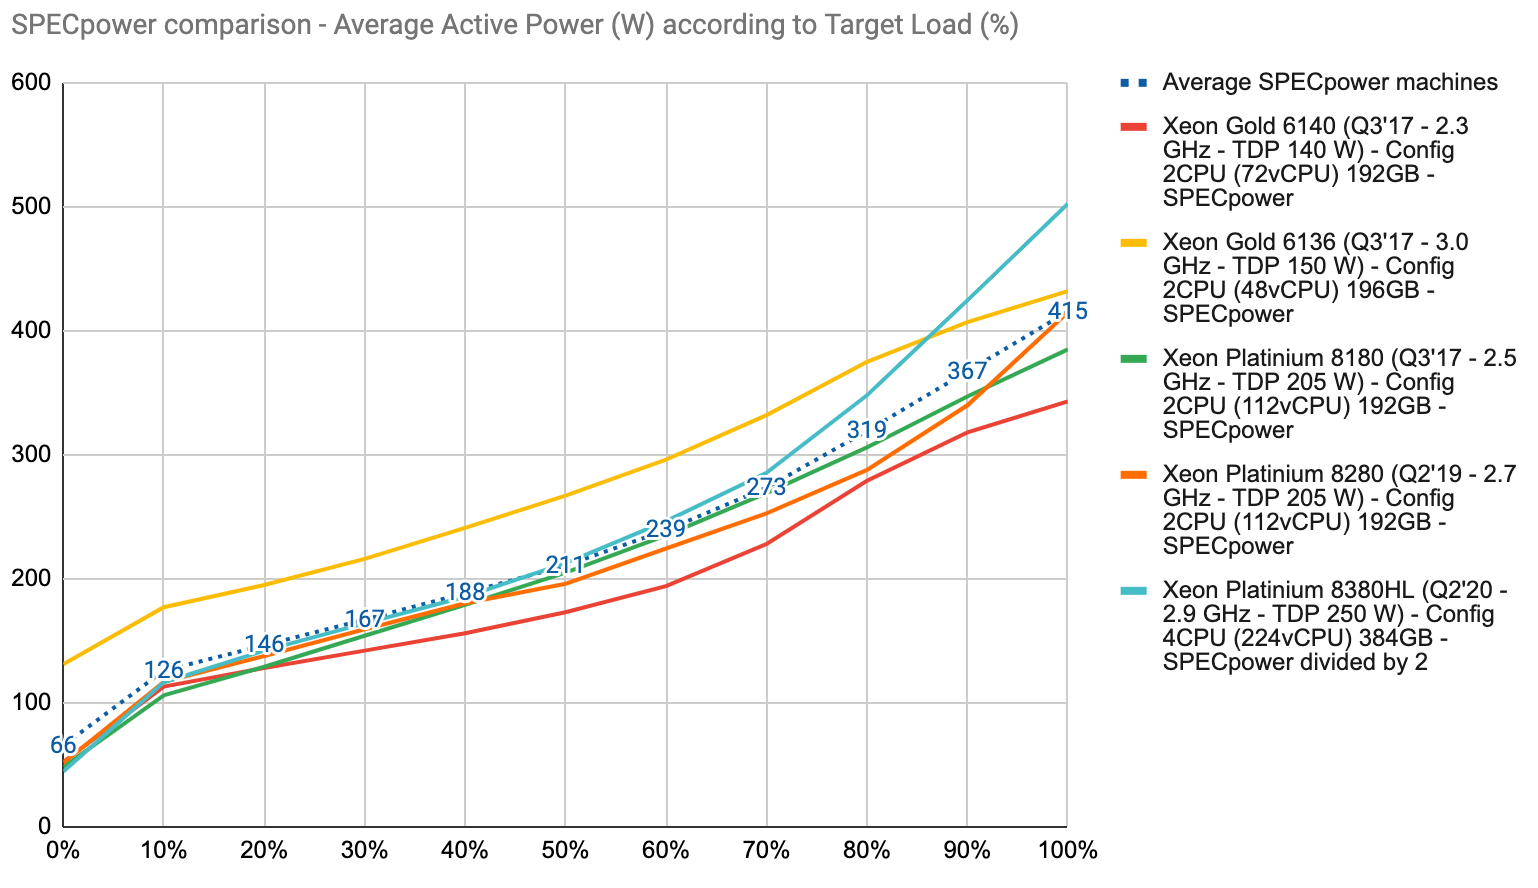
In the absence of more reliable information, an easy option would be to assume that these should be close enough compared to AWS hardware.
Unfortunately, as we will see later, that does not seem to be the case.
2 — Server power consumption distribution and modeling
Before jumping into power measurements we need to know more about how power consumption is distributed in a server. This will help us analyze our results and check if they make sense.
2.1 — Server power consumption drivers and factors
According to a recent study from Philippe Roose et al. [3] it is said that in a modern datacenter server (without GPU) the two largest power consumers are the CPU and memory.
CPU power consumption is usually defined using the TDP or Thermal Design Power. According to Intel, the TDP refers to:
“the power consumption (in watts) under the maximum theoretical load. Power consumption is less than TDP under lower loads. The TDP is the maximum power that one should be designing the system for.”
Knowing this, the TDP doesn’t really help to build power consumption profiles but it should be relevant enough to rank CPUs from least to most power-hungry.
There are multiple external factors which can also significantly impact CPU power consumption:
- Manufacturing, in a recent study, Yewan Wang et al. [4] observed a 7.8% power variation among 12 identical servers running the same test suites. Another study from Coles et al. [5] tested three servers with similar specifications and showed a 5% power variation, mainly due to the CPU.
- Thermal conditions, Yewan Wang also demonstrated that “the ambient temperature affects server power in two ways: through temperature sensitive components (i.e. CPU) and through server internal cooling fans”. The variation observed, here running a cpuburn benchmark, is significant: “with an Intel Xeon E5–2609v3 CPU, the power is increased by 16% when the temperature of CPU varies from 37.7°C to 74.5°C.”
Another factor that can have an impact is the type of workloads and instructions executed by the CPU. For example, it has been demonstrated by Amina Guermouche et al. [6] that AVX-512 instructions, usually used for HPC (High-Performance Computing) use cases, have a strong impact on power consumption.
Regarding memory consumption, we found some interesting data from DRAM manufacturers. Micron provides a calculator [7] and a power model [8] giving theoretical power consumption for each command for DDR4 memory systems.
In their example, we can see a power consumption of ~0,41W/GB. In its official documentation, memory manufacturer Crucial [9] says that: “As a rule of thumb, however, you want to allocate around 3 watts of power for every 8GB of DDR3 or DDR4 memory”. Which equals to ~0,38W/GB.
2.2 — Server power modeling
A lot of research has been done regarding power modeling at different scales (datacenter, server, virtual machine, down to the application level). There is a really interesting study from Leila Ismail that does a comparative evaluation of software-based power models for datacenter servers [10]. The study covers linear and non-linear models that use either mathematical or machine learning approaches. Another survey of power models has been published by Weiwei Lin et al. [11], this time for cloud servers specifically.
Looking at these studies, one of the key learnings is that models that only consider CPU utilization to estimate server power consumption have a high error rate compared to the ones considering also the memory (at least). Apart from CPU and memory, we might want to use a constant to take into account the other main components (storage and network).
3 — Building power consumption profiles for AWS instances
In a cloud environment, we can only use software metering tools. In our previous article, we discussed Intel RAPL (Running Average Power Limit), a software power meter available starting from Intel’s Sandy Bridge CPU architecture. Research from Fahad et al. [12] has demonstrated a good correlation between RAPL readings and system power meters. This feature has been experimented with success on EC2 instances by Nizam Khan et al. [13] by accessing RAPL counters through model-specific registers (MSRs).
3.1 — Reading RAPL counters on EC2
There are few resources about reading MSRs on EC2. Here is an old blog post from Brendan Gregg [14] where he explains how to read temperature levels on EC2. It’s also important to note that MSRs are specific to each processor family and to be able to read them we first have to look for their addresses in each Intel Datasheet, which aren’t reader-friendly.
There are different possible options [15] to read RAPL values, but from our different attempts on a c5.xlarge it seems that some MSRs are not accessible anymore on modern EC2 instances that use newer hypervisors (KVM). We didn’t spend too much time on it and directly tried our luck on bare metal instances.
Bare metal instances don’t have the same restrictions and we were quite happy to be able to simply access MSRs through Turbostat. This tool was written by Len Brown, Principal Engineer at Intel’s Open Source Technology Center and is recommended by AWS for performance analysis and stress testing purposes.

Here, we can confirm that the CPU used on our c5.metal has a 240 W TDP (power level 1).
On the bottom right we can see the power consumption reported in watts for each CPU at the package level (PkgWatt) and aggregated on top as well as memory power consumption (RAMwatt).
3.2 — Building a stress test protocol
Ideally, we want to measure our instance consumption under different loads. Looking at possible stress testing tools we found stress-ng, a tool that has a wide range of options and can help in performing granular stress tests (CPU, memory, IO).
One particularly interesting feature is the--cpu-load option that lets us define a target load for the test (called CPUStress later). However, it only performs CPU bounded stress tests (also called stressors), and this “target load” option isn’t available on other stress methods.
In order to confirm some of the hypothesis we had we also experimented other options :
--ipsec-mb, a stress test that performs cryptographic processing using advanced instructions likeAVX-512(test called ipsec later). We wanted to observe the impact of such instructions on power consumption.--vm, a test that specifically performs memory stress methods so that we can observe the impact of memory-intensive workloads (test called VMStress later).--maximize, in this test stress-ng will launch different types of stressors (CPU, cache, memory, file) and set these to the maximum settings allowed in order to get an estimate of a worst-case scenario (test called maximize later).
3.3 — Automating the experiments
We wanted our experiments to be easily repeated, reproduced, and verified. Vincent Miszczak packaged and automated Turbostat and stress-ng to automatically perform these tests and log the associated power consumption. We simply called this tool turbostress🔥, you can find it on our GitHub.
Several options are detailed in the documentation. By default, the tool will sequentially perform the previously listed stress tests using one stressor per available thread. Ten power consumption measures are performed during each test with a one-second wait between two measures and then a simple average is logged.
The first test is performed at different CPU loads and by default, this increment is set at 25%. For these experiments, we defined a 10% increment instead by using the flag: --load-step=10.
4 — Estimating the power consumption of AWS EC2 instances: getting the results
We have run the turbostress test suite on the c5, m5, r5, z1d, and m5zn bare metal instances and logged the results. We detail our findings below.
4.1 — CPU load tests
In this test, stress-ng spawns one stressor per thread and exercises the CPU by sequentially running different stress methods. These are supposed to cover the variety of possible workloads we can have in production. This test is performed for each load increment until it reaches 100%.
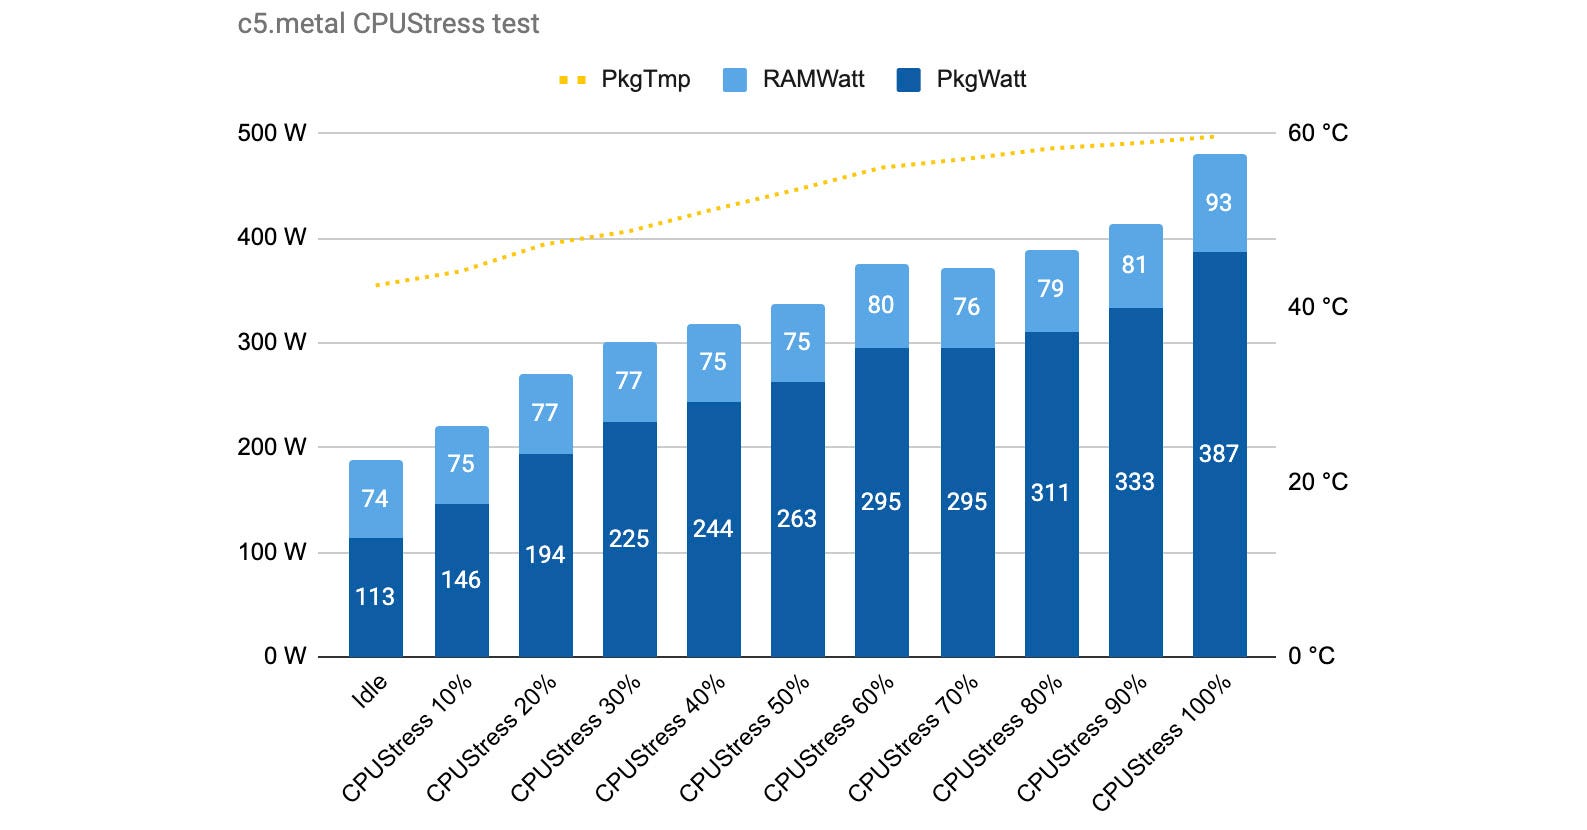
As we can see in this test for the c5.metal, memory consumption is stable while CPU consumption increases with the target load. This is expected as our test is a CPU-bound workload.
What’s also interesting is that our first measure without any workload (idle) shows that our instance is already consuming 187 watts. This already seems a lot higher than the “active idle” value we observed in SPECpower reports, and we are only measuring CPU + memory consumption here. We also log the CPU package temperature that is available in Turbostat and see that it increases as we add more load as expected.
Now let’s compare CPU-only consumptions for our five instance types (c5, r5, m5, z1d, and m5zn).
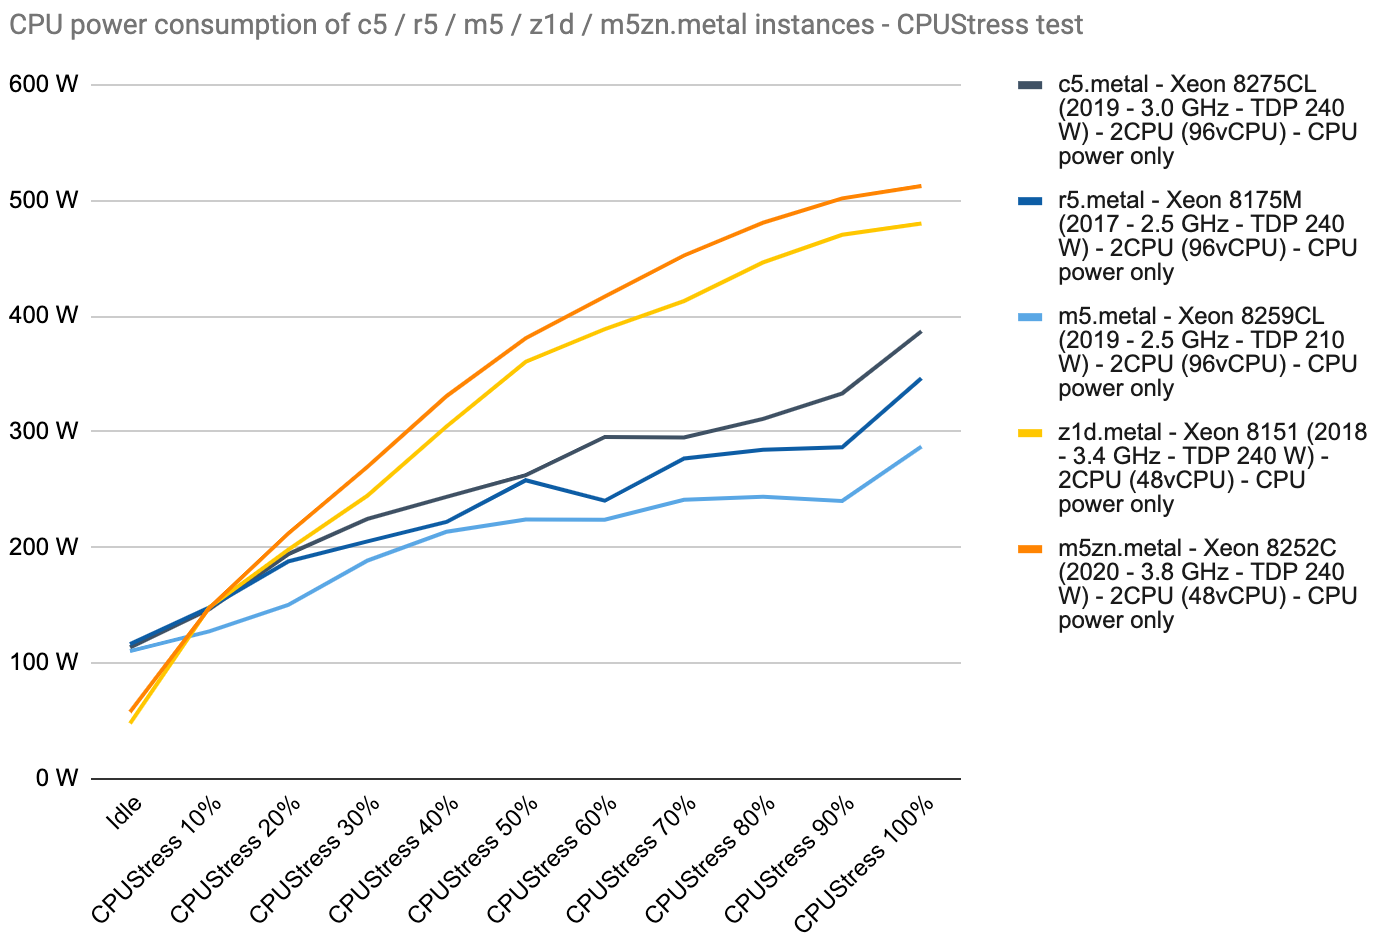
We can see that the three 96 vCPU configurations (c5, r5, m5) are ranking according to their CPU base frequency and TDP which is expected. Despite having the same 240 W TDP, the two compute-intensive instances (z1d, m5zn) have a lower idle consumption and then consumption quickly increases to reach ~500 W.
Our measurement protocol might be imperfect as we can see some downward variations but overall these curves give us a good idea of how CPU power consumption evolves when load is increased. Idle values are quite close for each instance group. If we look at the CPU consumption per thread (vCPU) we obtain the following:

Differences at high load between comparable instances can be significant (c5 and m5). We can also see the impact of high-frequency cores (z1d, m5zn). This encourages us to consider building power profiles for the instance types and families we use the most rather than settling for a one-size-fits-all approach.
4.2 — Memory intensive tests
We learned earlier that DDR4 memory consumption should be around ~0,4W/GB for normal workloads. We also saw that memory consumption was quite stable in our first CPUStress test. This was observed for all the instances.
Our test machines have 192, 384 or 768 GB of memory. Let’s see how that affects the overall power consumption. In the graph below, we compare the average memory consumption logged for the CPUStress tests with the consumption reported for the memory-intensive test (called VMStress) and the maximize test that is supposed to also put pressure on the memory.
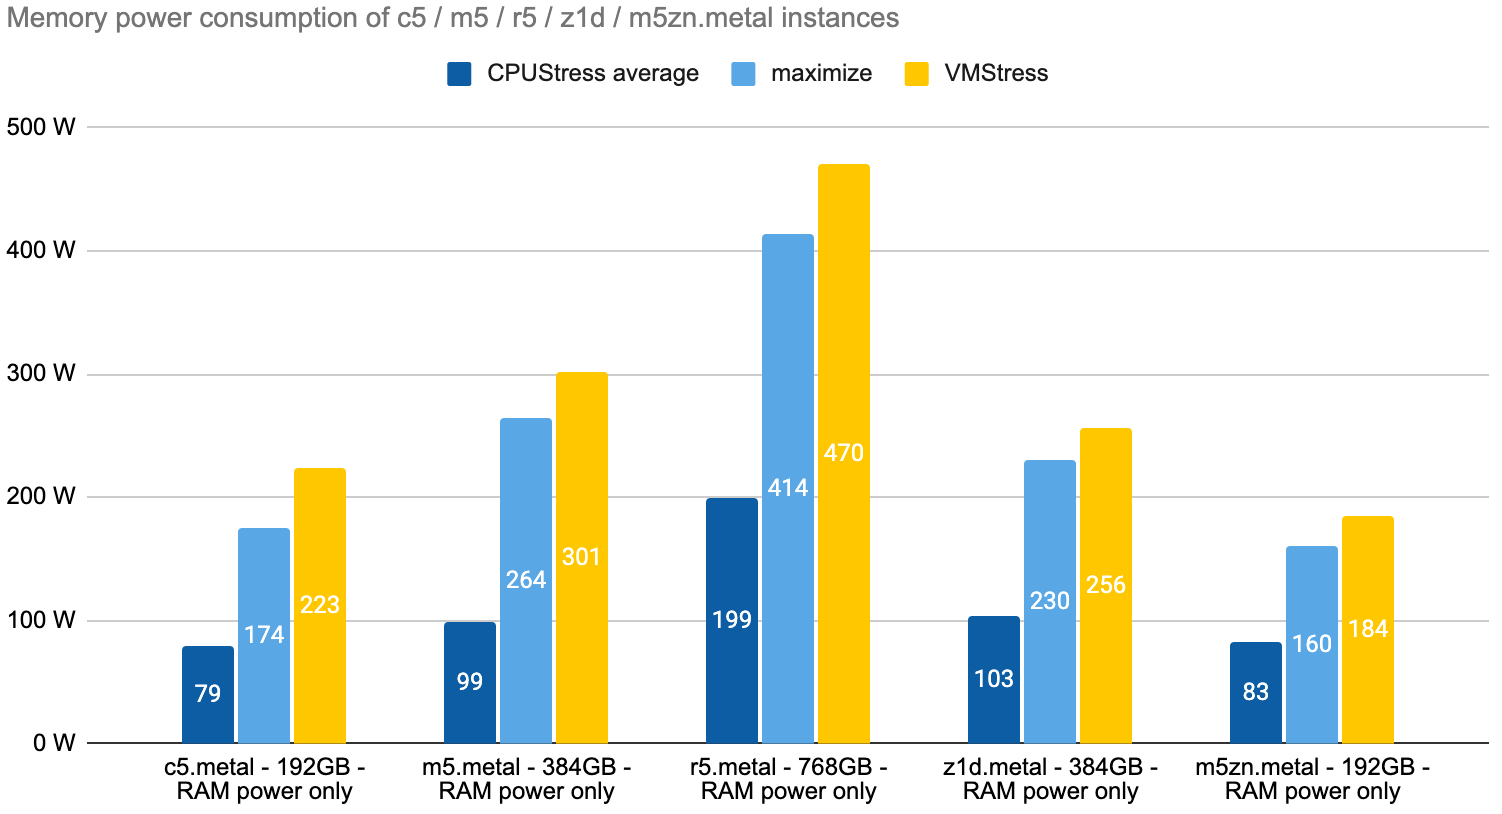
As expected, memory quantity is reflected in the measures. What’s interesting is that the VMStress test brings the memory consumption from 79 watts to 223 watts on the c5.metal instance and this increase is also visible for the other instances.
See also: SFDR looks beyond the balance sheet, through greenwashing. Data strategies must change
This confirms that modeling server consumption solely on CPU utilization can be significantly wrong, especially with the growing volume of memory available in modern cloud servers. On the r5.metal, memory consumption largely exceeds CPU consumption in both the maximize and VMStress tests (details are provided in section 4.3).
Here is a recap reported in W/GB, we can see that memory-optimized instances feature a better power efficiency.

We cannot easily test different loads for the memory, one option could be to consider that consumption scales linearly starting from the baseline observed in the CPUStress test, up to the VMStress test high. Again, we are first and foremost looking for acceptable estimates and know we will never be perfectly accurate.
4.3 — CPU intensive tests with AVX-512 instructions
Another scenario we wanted to investigate is the impact of advanced CPU instructions such as AVX-512. Here we compare power consumption metrics for four tests that fully load the CPU.
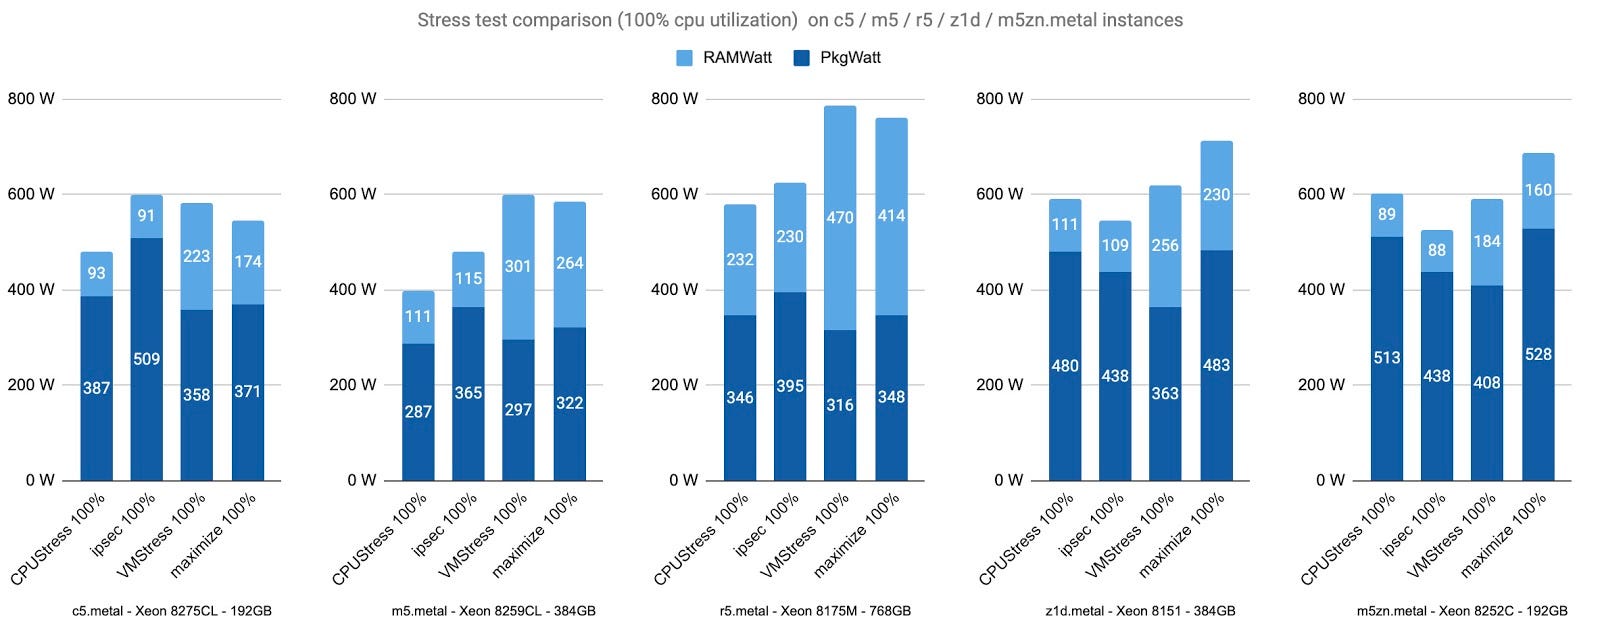
In all these tests the CPU shows a 100% load, our results confirm that CPU consumption is linked to workload types rather than only utilization. We can also observe the impact of AVX-512 instructions. CPU consumption is at its maximum in the ipsec test for the c5, r5, and m5. On the c5.metal, reported consumption for the two CPUs reaches 509W, thus exceeding the TDP (PL1) of the Xeon 8275CL (2 * 240W).
Interestingly on the z1d and m5zn, the ipsec test isn’t the one showing the highest power consumption. It’s maybe due to the dynamic frequency scaling that reduces the base frequency of the processor whenever AVX2 or AVX-512 instructions are used. It might have a bigger impact on CPUs running at a high frequency.
In this overview, we can also observe the importance of memory consumption on the m5.metal and even more on the r5.metal.
4.4 — Comparison with SPECpower profiles
Of course, we cannot really compare our figures with SPECpower reports as the methodology differs significantly (throughput versus CPU utilization rates). On AWS we only have CPU and memory consumption estimated by RAPL whereas SPECpower data comes from power analyzers that measure the whole server.
However, we can at least try to compare pseudo consumption profiles. Here we simply consider a linear consumption profile for the c5.metal starting with our idle measurement. We use the average consumption measured on this instance on our four “100%” experiments as the maximum. We compare this with the average consumption reported by our SPECpower selection of machines with comparable specifications.
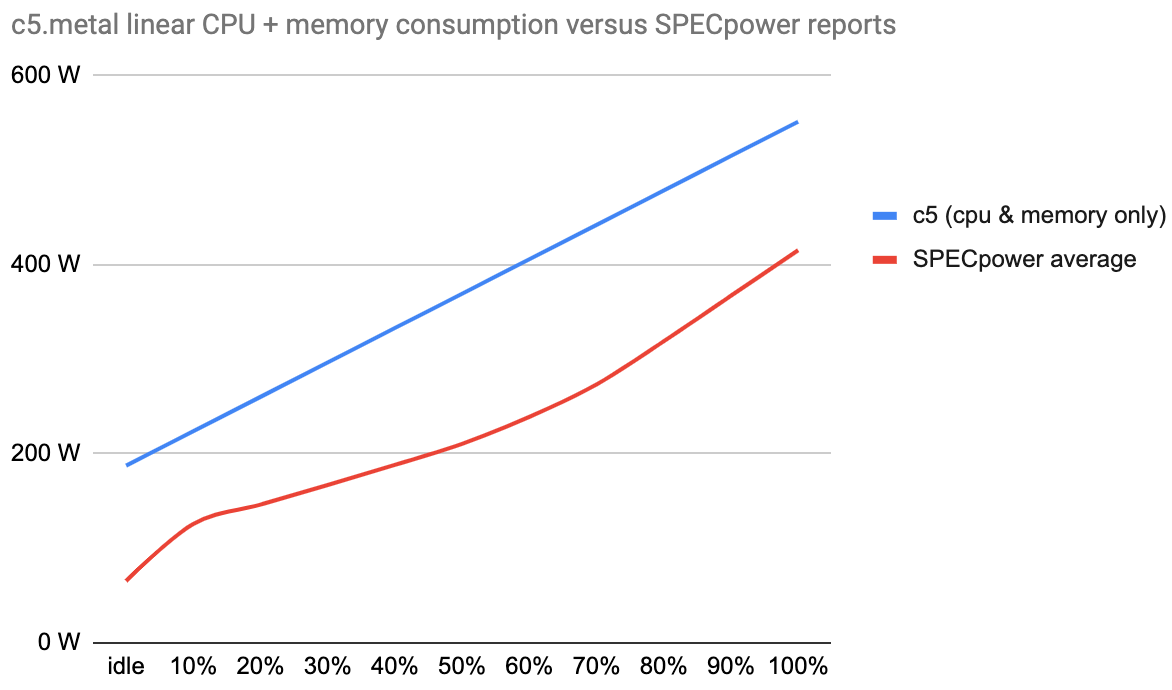
At least both slopes are looking similar! However, if our measurements are not too wrong it means that using SPECpower data for the c5 would greatly underestimate actual power consumption.
There are several reasons that could explain this gap:
- We failed at finding comparable machines in the SPECpower database. Indeed CPUs are not exactly matching and have an average lower TDP in our selection, however, they are from the same Xeon family.
- Our tooling is biased. RAPL readings are off and/or stress-ng tests are flawed, even if some more robust studies demonstrated that RAPL could be a good proxy to actual power consumption it’s not as accurate as a power analyzer.
- Our experiment protocol is wrong, stress test sessions are too short and the simple average method we use doesn’t handle well potential outliers. We would need to do more tests to confirm, our different sessions showed relatively consistent measures but we kept them short (60 measures per test maximum).
4.5 — Converting to virtual machines
We still need to take into account the other resources that we are not measuring. From what we have seen in some power models, a simple constant could be ok as memory and CPU are the main power proportional components in a server. For the sake of simplicity and to avoid any arbitrary heuristic we will wait for on-premise measurements to set this constant.
Now, if we consider CPU and memory to be the bulk of the power consumption for an active instance we can estimate it for virtual machines. Here we simply use the vCPU as a factor to “cut” power consumption the same way resources are supposedly allocated.
We obtain a “per vCPU” consumption profile that can be easily applied to our EC2 usage reporting and crossed with the CloudWatch CPUUtilization metric. Here we use the same linear projection from idle to max load as in the SPECpower comparison.

If we use this table to estimate the consumption of a c5.xlarge (4 vCPUs) running at 80% we will consider 4*5 = 20 watts per hour.
5 — Key Takeaways
Even though this study has several limitations it helped us get a better grasp of the power modeling challenges for cloud servers and more specifically EC2 machines:
- First, there are many external factors that should be considered and can greatly impact actual server consumption, such as manufacturing and thermal conditions. In a cloud context, this isn’t something we can manage and we can have different hardware generations for the same instance type.
- For a given CPU utilization rate, the actual power consumption is tied to the type of workload that is processed. We have seen significant variations across our tests and confirmed that advanced AVX-512 instructions can be power-hungry compared to more common instructions (visible on the c5, r5, and m5 instances).
- Memory shouldn’t be considered to have a marginal footprint. According to RAPL, it can even exceed CPU consumption in some configurations. Our measurements are close to memory manufacturers' benchmarks which is reassuring.
- Finally, using a statistical approach based on SPECpower data could greatly underestimate power consumption for AWS instances, at least for the Intel Xeon-based configurations we tested.
If we look at these results with sustainability goals in mind we can say that, in terms of overall power consumption, it seems like a good idea to maximize the load on our instances to optimize our resources and environmental footprint.
Even if cloud providers work on Energy-Proportional Computing strategies [16] to minimize wastage, our measurements show that once the instance is available to us its power consumption can be significant, even when idle (power overhead).
Having these consumption profiles for the main instances we use help us get a step closer to be able to estimate the carbon footprint of our software platform.
Call for contribution
We have imagined our power measurement protocol to be easily reproduced and challenged. We are looking for help to check how these software measurements would compare with on-premise measurements using power analyzers. This could help us check the accuracy of our approach and eventually straighten up the data (CPU + memory) to the whole system.
It would also be interesting to have these tests performed on different machines and on longer stress test sessions to observe variations. Please do not hesitate to contribute on GitHub and share your results with other hardware.
🙏 Many thanks to Antoine Brechon for his help in navigating and testing RAPL options on EC2 and especially to Vincent Miszczak for building turbostress and helping in the experiments. Thanks also to Caroline Agase for reviewing the article, which first appeared on Medium.