
An inability to track and report the emissions generated by cloud-based workloads as been a persistent bugbear for those working at the intersection of IT and sustainability. Google Cloud (GCP) took a (very) modest step towards improving reporting this week with a new "Carbon Free Energy Percentage (CFE%)" tool that lets users see which GCP data centres are cleanest and allocate workloads, where possible, accordingly.
The CFE% reporting tool, if limited, is a step forwards for companies or organisations tracking Scope 3 emissions (carbon emissions from "value chain" partners beyond immediate control of the reporter) -- which are becoming an increasingly important issue for those seeking to comprehensively track and report their climate impact.
The Google Cloud emissions tool also includes a grid carbon intensity (gCO2eq/kWh) metric that indicates average lifecycle gross emissions per unit of energy from the grid that lets users track, crudely, the relative emissions for when their workloads are not running on carbon free energy: "As an example, Frankfurt and the Netherlands have similar CFE scores, but the Netherlands has a higher emissions factor."
As Benjamin Davy, of media technology platform Teads has lucidly demonstrated here, tracking Scope 3 emissions from IT usage, in particular from cloud usage, remains a horrendously inaccurate process -- thanks in large part to the failure of large cloud providers to provide detailed data. As Davy noted in December 2020:
- "The physical location of the infrastructure isn’t precise. For example, AWS has a single region in Virginia but has 55 physical data centers in that geography. This forces us to use energy mix intensity aggregates on a regional level for our calculations.
- Cloud providers often develop their own custom hardware for which we don’t have any specifications or lifecycle information.
- We run virtual machines and do not precisely know the corresponding physical server specifications. It gets even harder for serverless services (marginal usage in our case, but still).
- Each instance family and generation has a specific footprint.
- VM allocation ⁷ has a significant impact on actual energy consumption.
- Actual server energy consumption doesn’t scale linearly according to CPU load and requires modeling."
See also: “Through a glass, darkly?” Making sense of Data Centre sustainability
Tracking back to GCP, its tool shows that Sydney, Singapore, Taiwan and South Carolina all stand out as relying heavily on fossil fuel sources still, with Europe performing better broadly better as a region. The top performing data centres in terms of carbon free energy however were largely Americas based: Oregon, Sao Paulo, and Oregon.
On average according a snapshot published by GCP as calculated by The Stack, carbon free energy was powering 51% of GCP data centres. For all the hyperscalers' pledges to be carbon neutral in the near term, there is clearly still considerable work to do, although we applaud Google's efforts towards transparency: it is publishing the average hourly CFE% for the majority of its GCP regions here and on GitHub.
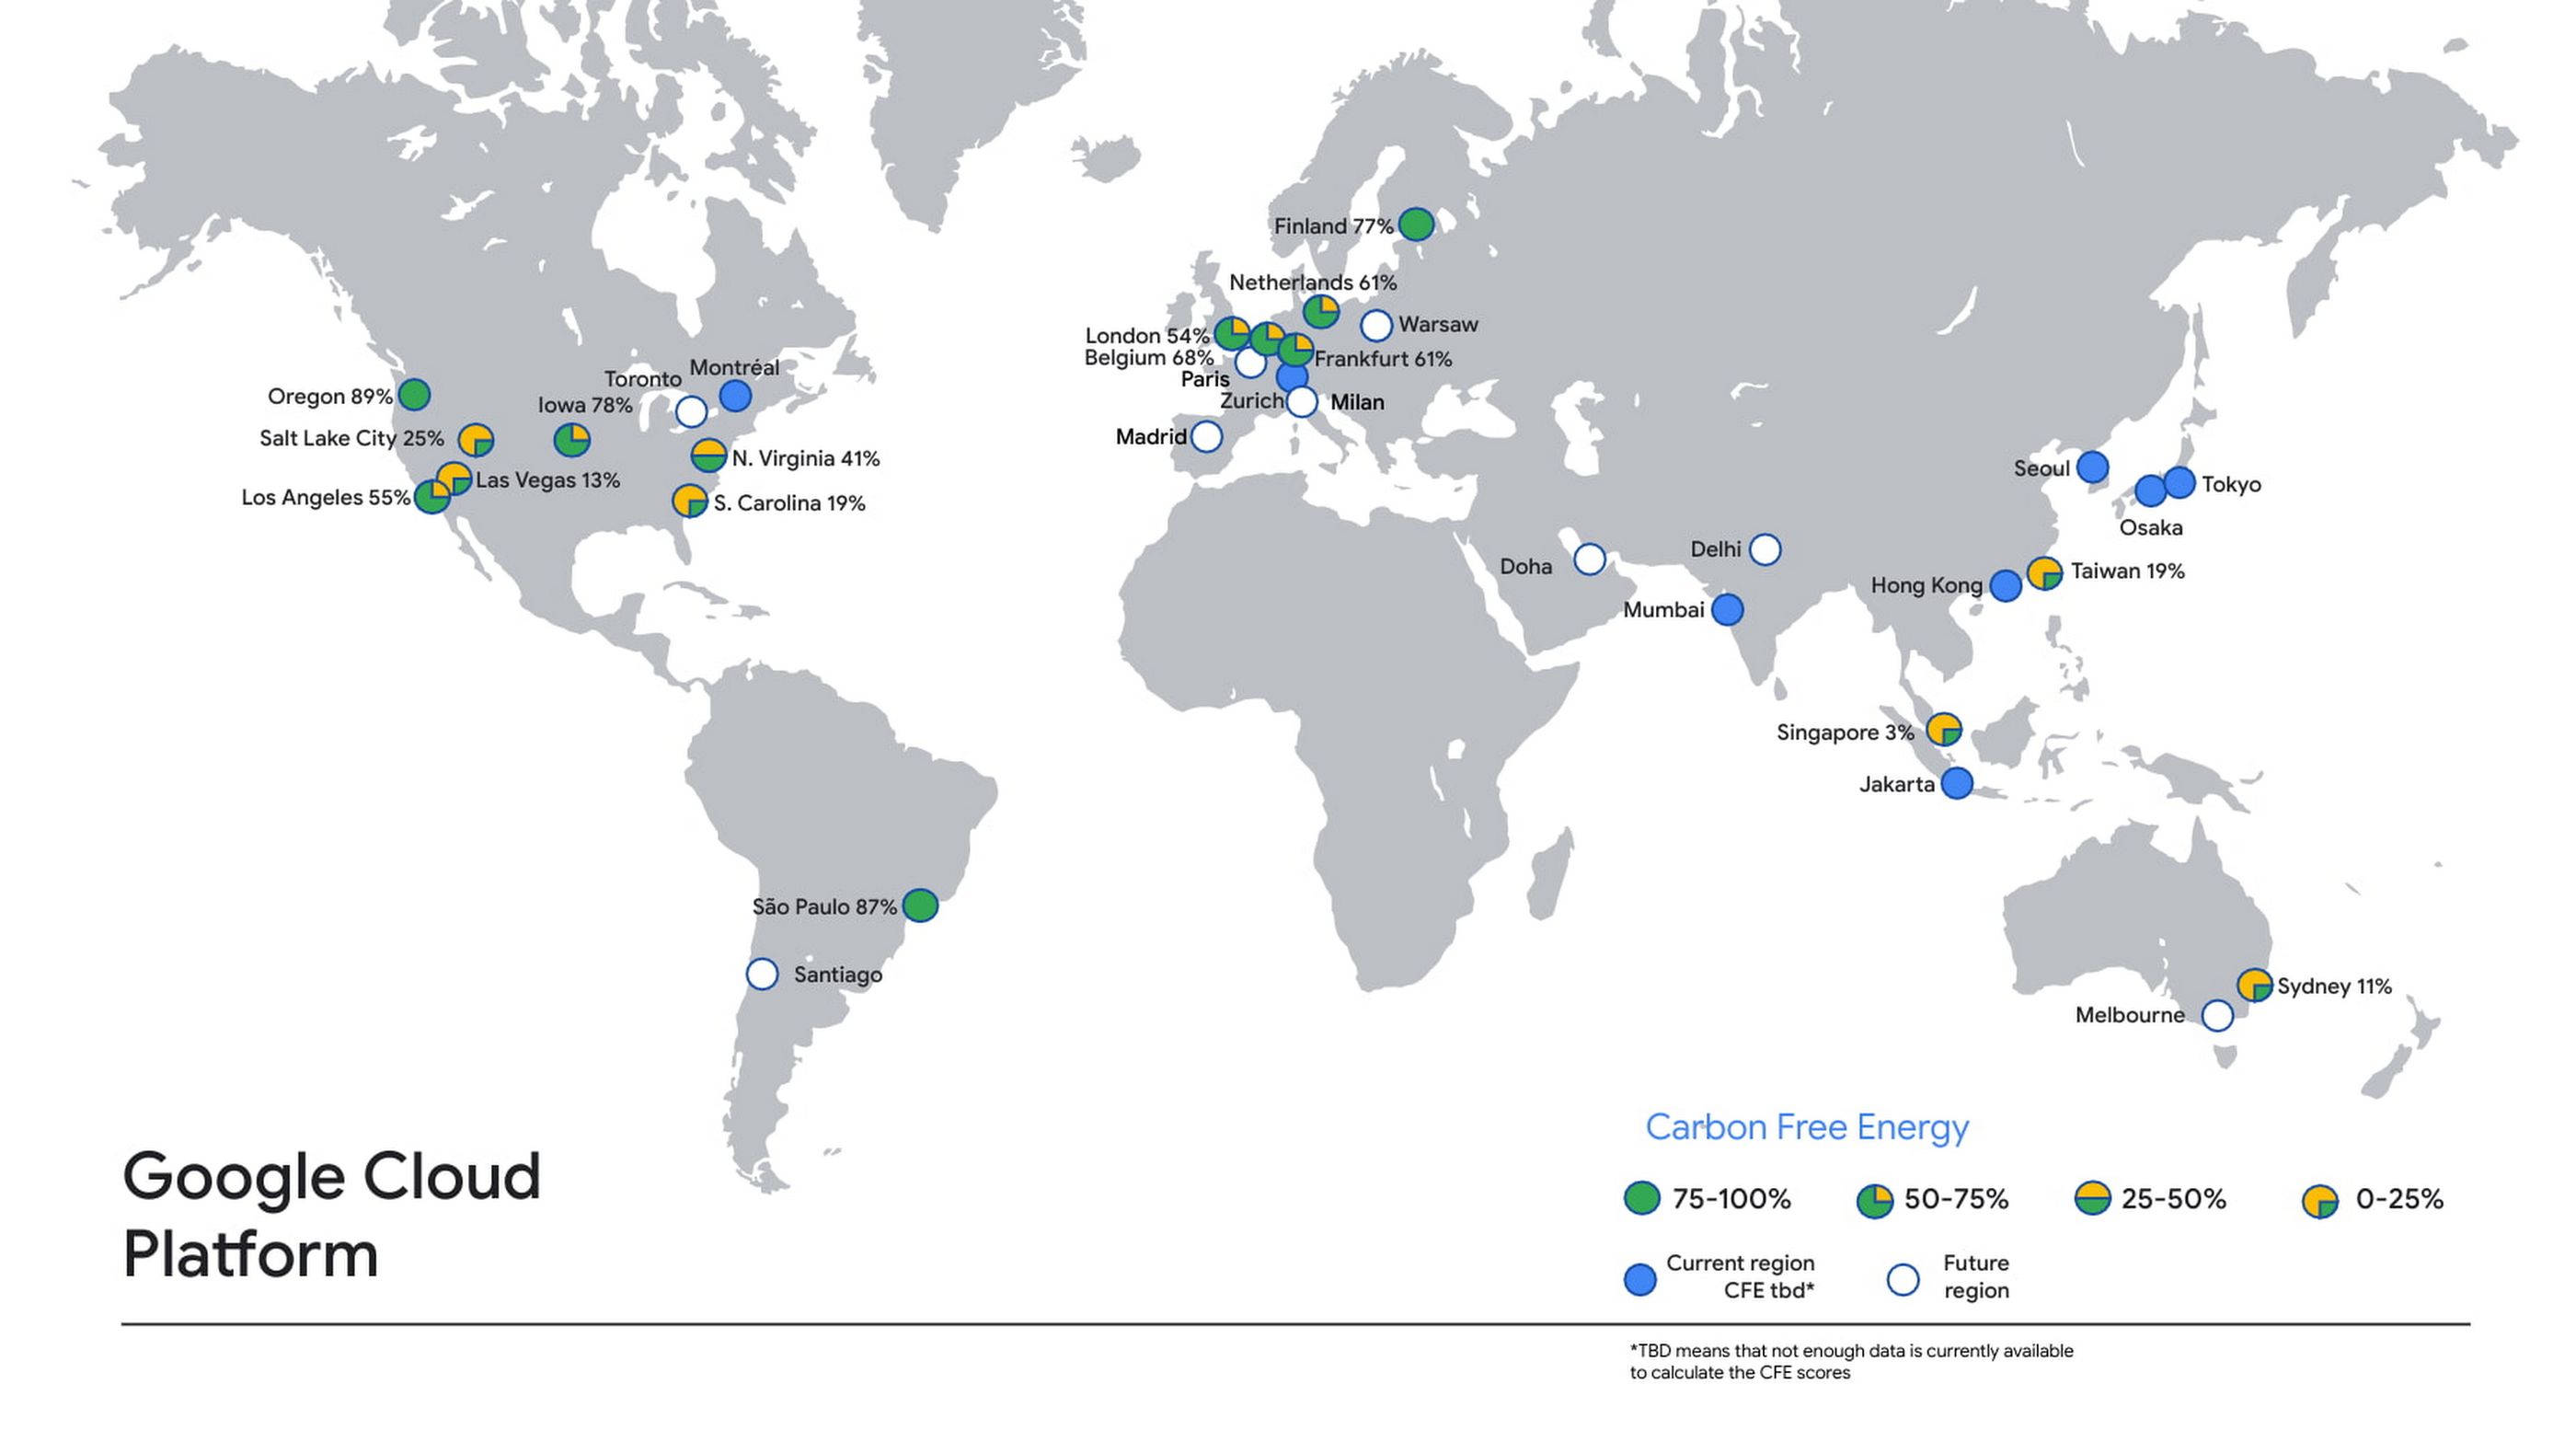
GCP noted: "As we work on increasing the CFE% for each of our Google Cloud regions, you can take advantage of locations with a higher percentage of carbon-free energy. You must also consider your data residency, performance and redundancy requirements, but here are some good ways to reduce the associated gross carbon emissions of your workload:
Read this: Climate risk data is a hot mess. These open source pioneers want to set things straight.
- Pick a lower-carbon region for your new applications. Cloud applications have a tendency to stay put once built, so build and run your new applications in the region with the highest CFE% available to you.
- Run batch jobs in a lower carbon region. Batch workloads are often planned ahead, so picking the region with the highest CFE% will increase the carbon-free energy supplying the job.
- Set an organizational policy for lower carbon regions. You can restrict the location of your cloud resources to a particular region or subset of regions using organizational policies. For example, if you want to use only US-based regions, restricting your workloads to run Iowa and Oregon, currently the leading CFE% leaders, rather than Las Vegas and S. Carolina would mean your app would be supplied by carbon-free energy an average of 68% more often."
The Stack understands that AWS has been trialling similar disclosures under a non-disclosure basis with certain organisational partners but does not have an equivalent public tool. Azure, meanwhile, released a Power BI-based application for Azure enterprise customers in January 2020 that provides insight into carbon emissions data associated with their Azure services. This provides "factors in inputs such as the energy requirements of the Azure service, the energy mix of the electric grid serving the hosting datacenters, Microsoft’s procurement of renewable energy in those datacenters, as well as the emissions associated with the transfer of data over the internet." It is not a publicly visible or usable tool.


