
Fathom was SME winner of The Stack's 2021 Tech for Good awards
Mapping the Earth’s topography, or the shape of the Earth’s surface, used to be largely of interest to the military, civil engineers and academia. With the advent of smartphone apps, however, these datasets have entered the public consciousness, in the form of countless services that let us seamlessly navigate and interact with complex geographical and geospatial data. Or just track and share our Sunday morning bike ride.
In the corporate world, geospatial data and analysis is now firmly on the boardroom agenda, writes Dr Andrew Smith, COO, Fathom. From CEOs and CIOs, to risk officers and data scientists, terrain datasets known as Digital Elevation Models (DEMs) are being used in business processes far beyond consumer smartphone apps.
Companies are using DEMs in risk mitigation, compliance, engineering, infrastructure and automotive use cases. In public services and NGOs, DEM datasets are being employed to map potentially hazardous areas, plan future emergency response and to coordinate rescue and aid missions in the wake of natural disasters.
Digital Elevation Models, or DEMs explained
DEMs take the form of either a Digital Surface Model (DSM) or Digital Terrain Model (DTM), with the former containing surface artefacts such as buildings and trees and the latter retaining just the information on the underlying terrain, or the bare earth itself. These datasets can be collected in a variety of ways, including laser altimeter data (LiDAR) collected via aircraft surveys and data collected from space using near-infrared, radar and visible sensors. At a global scale, it is this latter category of data collection that we are limited to. Consequently, this has presented some significant challenges in obtaining an accurate picture of the Earth’s surface over the past few decades.
Follow The Stack on LinkedIn
Global terrain data fall under the category of DSM, retaining surface features as radar beams bounce off the tops of trees, buildings, and other artefacts. For some applications, such as risk mitigation, the presence of these artefacts precludes our ability to use them in an accurate way. Think of the difference it would make if you were in a tall building during a flood – the difference of just a few metres can have a huge impact on the devastating effects of flooding. Put simply, without an accurate map of the entire Earth surface, mapping and avoiding the most hazardous locations becomes very difficult. Yet recent research suggests that if we avoid using and building on hazardous areas we can avoid the majority of future risk. As we try to manage the impact of climate change on changing weather patterns, identifying risky areas is becoming increasingly important.
The challenge of data scarcity
Mapping of this kind is precisely what we do at Fathom, building flood models that cover the whole planet. Our data are used across multiple industries including (re)insurance, engineering, financial markets, corporate risk management and disaster response. Until recently, our ability to build models at global scales was severely limited by the availability of accurate terrain data. In data poor areas, we were reliant on a legacy dataset that was derived from a radar product collected by NASA’s Space Shuttle, called the Shuttle Radar Topography Mission (SRTM). This dataset is over 20 years old and is riddled with instrumentation errors, alongside superfluous surface features, including newly built urban construction. These need to be removed in order to build an accurate flood model.
This all changed last year when a new global terrain dataset called Copernicus GLO-30 (COPDEM30) was released by the European Space Agency. COPDEM30 is a ~30m resolution DSM collected by the TanDEM-X mission, a mission whose sensors operate at a native resolution of ~12m. The precision and accuracy of the missions’ sensors ensured that COPDEM30 became the new gold standard in global terrain mapping, containing far more information than previous datasets. However, the data still represent a DSM; to unlock the true functionality of the data, all the surface features needed to be stripped out. This is where the global hydrology, and particularly the flood hazard modelling community, came into the picture.
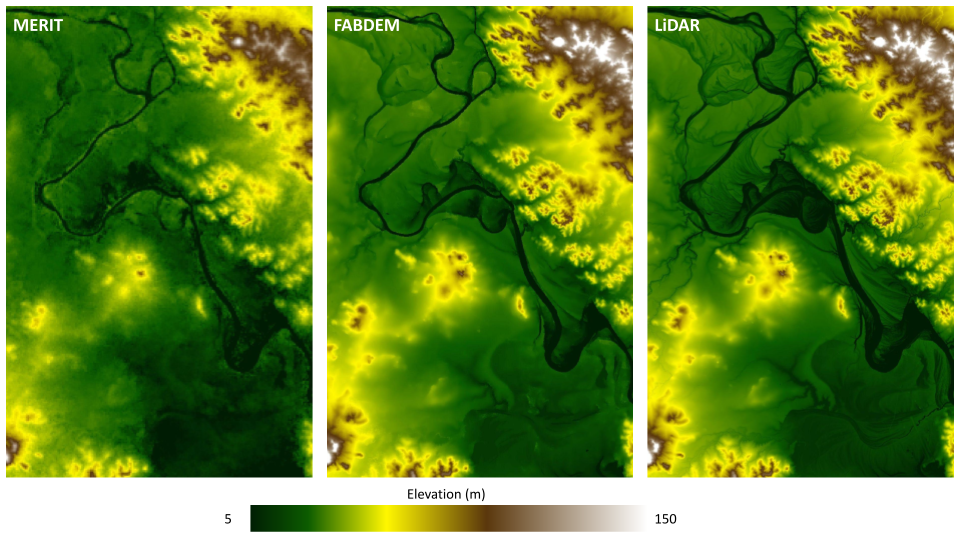
Figure 1: Example of different terrain datasets in Rockhampton, Australia. On the left is MERIT DEM, a terrain dataset derived from SRTM. In the middle is the recently released FABDEM and on the right is a locally derived aircraft-surveyed LiDAR terrain dataset that can be regarded as the benchmark.
Machine learning in mapping
In endeavouring to build global flood hazard models over the past 20 years, the flood modelling community have become the de facto experts in processing DSM data into DTM data. A year after the release of COPDEM30, a team of flood modellers released the Forest and Buildings removed Copernicus DEM (FABDEM), a global DTM resulting from a reprocessing of COPDEM30. The team behind FABDEM trained machine learning (ML) algorithms on a suite of predictor variables to estimate the location of artefacts and to characterise artefact size. These ML trained algorithms were deployed to remove all the estimated surface artefacts in the COPDEM30 dataset. The result was a global DTM, representing a significant step forward in our ability to model the bare surface of the Earth.
See also: Geospatial data and powerful algorithms are transforming flood risk modelling, but investors need to be careful.
An obvious area of application for this new dataset is the realm of flood modelling, particularly in data poor areas. Flood models typically simulate the propagation of water across the Earth’s surface. They therefore require an accurate terrain dataset over which to simulate the flow of water. The advent of FABDEM ensures that even in areas where no local information is available, useful flood hazard information can be derived. This means that we can provide meaningful, actionable risk information anywhere in the world. For example, we can deploy FABDEM to avoid construction and development in the most flood prone regions, including a recent project where Fathom’s global data were used to identify safe locations to build schools in rural Peru.
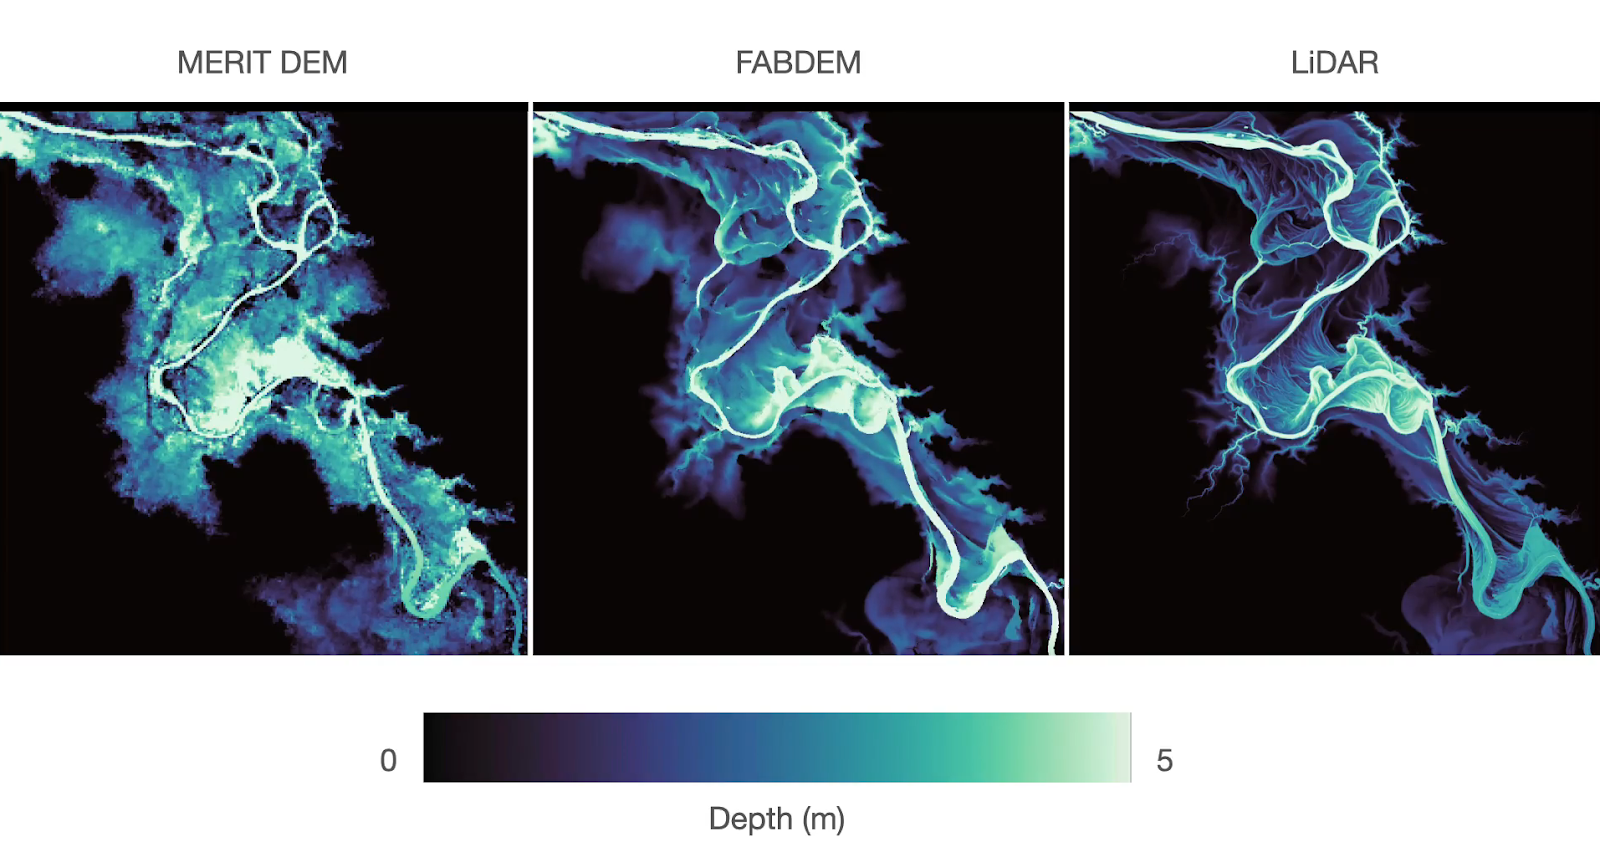
Figure 2: Flood hazard simulation across the three different terrain datasets presented in Figure 1.
But the relevance of these data goes far beyond flood modelling and indeed beyond all forms of hazard modelling. These data can be deployed wherever an accurate model of the Earth’s surface is required; from infrastructure planning and industrial visualisation to the navigation apps on the smartphones of billions of people. The next time you use an app to map your office commute or your morning bike ride, it may well be that the underlying data were produced by a small group of scientists from the world of flood modelling.
About FABDEM
FABDEM lets you build powerful maps and 3D simulations of the earth’s surface and accurately model natural hazards. Derived from Copernicus GLO 30 and built using machine learning methods, FABDEM is the first global digital elevation model to remove forests and buildings at a 30-metre resolution to give a true picture of ground-level terrain. Developed in tandem with the University of Bristol, FABDEM’s high-resolution digital terrain data ensure it is valuable across the insurance and engineering sectors, and for GIS mapping and geospatial analysis. For more information, visit: https://www.fathom.global/product/fabdem/


